OpenACC Tutorial - Profiling: Difference between revisions
No edit summary |
No edit summary |
||
| Line 58: | Line 58: | ||
}} | }} | ||
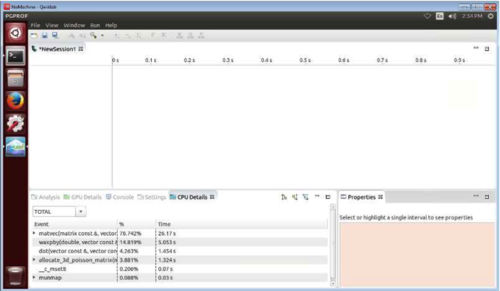
Bellow are several snapshots demonstrating how to start with the PGPROF profiler. First step is to initiate a new session. | |||
[[File:Pgprof- | |||
[[File:Pgprof-pic1.png|thumbnail|500px|Starting new session|left ]] | |||
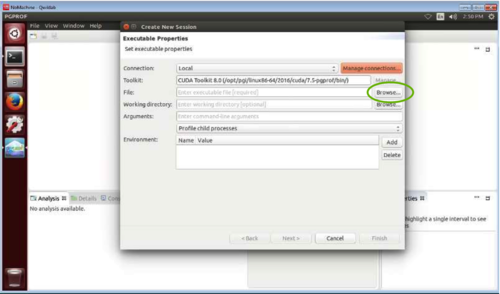
Then browse for an executable file of the code you want to profile. | |||
[[File:Pgprof-pic2.png|thumbnail|500px|Browse for executable you want to profile|left ]] | |||
Then specify the profiling options. For example, if you need to profile CPU activity then set the "Profile execution of the CPU" box. | |||
[[File:Pgprof-pic2.png|thumbnail|500px|Browse for executable you want to profile|left ]] | |||
Revision as of 18:57, 6 June 2016
- Understand what profiler is
- Understand how to use PGPROF profiler.
- Understand how the code is performing .
- Understand where to focus your time and re-write most time consuming routines
- Learn how to ...
What is profiling ?
Gathering a Profile
Why would one needs to gather a profile of a code ? Because it's the only way to understand:
- Where time is being spent (Hotspots)
- How the code is performing
- Where to focus your time
What is so important about the hotspots of the code ? The Amdahl's law says that "Parallelizing the most time-consuming (i.e. the hotspots) routines will have the most impact".
Build the Sample Code ?
For this example we will use a code from the repositories. Download the package and change to the cpp or f90 directory. The point of this exercise is to compile&link the code, obtain executable, and then profile them.
As of May 2016, compiler support for OpenACC is still relatively scarce. Being pushed by NVidia, through its Portland Group division, as well as by Cray, these two lines of compilers offer the most advanced OpenACC support. GNU Compiler support for OpenACC exists, but is considered experimental in version 5. It is expected to be officially supported in version 6 of the compiler.
For the purpose of this tutorial, we use version 16.3 of the Portland Group compilers. We note that Portland Group compilers are free for academic usage.
[name@server ~]$ make
pgc++ -fast   -c -o main.o main.cpp
"vector.h", line 30: warning: variable "vcoefs" was declared but never
       referenced
       double *vcoefs=v.coefs;
                    ^

pgc++ main.o -o cg.x -fast
After the executable is created, we are going to profile that code.
For the purpose of this tutorial, we use a PGPROF, a powerful and simple analyzer for parallel programs written with OpenMP or OpenACC directives, or with CUDA We note that Portland Group Profiler is free for academic usage.
Bellow are several snapshots demonstrating how to start with the PGPROF profiler. First step is to initiate a new session.
Then browse for an executable file of the code you want to profile.
Then specify the profiling options. For example, if you need to profile CPU activity then set the "Profile execution of the CPU" box.

