Pgdbg/en: Difference between revisions
(Updating to match new version of source page) |
(No difference)
|
Revision as of 17:20, 16 July 2019
PGDBG is a powerful and simple tool for debugging both MPI-parallel and OpenMP thread-parallel Linux applications. It is included in the PGI compiler package and configured for OpenMP thread-parallel debugging.
For the most of the C, C++, or Fortran 77 codes one can use a regular GNU debugger such as GDB. However, the Fortran 90/95 programs are not handled very well by the GDB. The Portland Group has developed a debugger called pgdbg which is more suited for such codes. Pgdbg is provided in two modes: a graphical mode with the enabled X11 forwarding or a text mode.
Quickstart guide
Using PGDBG usually consists of two steps:
- Compilation: Compile the code with the debugging enabled
- Execution and debugging: Execute the code and analyze the results
The actual debugging can be accomplished in either command-line mode or graphical mode.
Environment modules
Before you start profiling with PGDBG, the appropriate module needs to be loaded.
PGDBG is part of the PGI compiler package, so run module avail pgi to see what versions are currently available with the compiler, MPI, and CUDA modules you have loaded. For a comprehensive list of PGI modules, run module -r spider '.*pgi.*'.
As of December 2018, these were:
- pgi/13.10
- pgi/17.3
Use module load pgi/version to select a version; for example, to load the PGI compiler version 17.3, use
[name@server ~]$ module load pgi/17.3
Compiling your code
To be able to debug with pgdbg you first need to compile your code with debugging information enabled. With the pgdbg you do so by adding a debugging flag "-g":
[name@server ~]$ pgcc -g program.c -o program
Command-line mode
Once your code is compiled with the proper options, you can run the PGDBG for the analysis. The debugger's default user interface is a graphical user interface or GUI. However, if for some reasons you don't want to run in GUI or don't have X11 forwarding, you can run pgdbg in a text mode by adding an extra option "-text" :
[name@server ~]$ pgdbg -text program arg1 arg2
Once the PGDBG is invoked in the command-line mode, you will have an access to prompt:
[name@server ~]$ pgdbg -text program
PGDBG 17.3-0 x86-64 (Cluster, 256 Process)
PGI Compilers and Tools
Copyright (c) 2017, NVIDIA CORPORATION.  All rights reserved.
Loaded: /home/user/program
pgdbg>
Before you can debug you need to execute run in the prompt:
[name@server ~]$
pgdbg> run
PGDBG automatically attaches to new threads as they are created during program execution. PGDBG describes when a new thread is created. During a debug session, at any one time, PGDBG operates in the context of a single thread, the current thread. The current thread is chosen by using the thread command. The threads command lists all threads currently employed by an active program:
[name@server ~]$ pgdbg > threads
0  ID PID    STATE      SIGNAL      LOCATION
   3  18399  Stopped    SIGTRAP     main line: 31 in "omp.c" address: 0x80490ab
=> 2  18398  Stopped    SIGTRAP     main line: 32 in "omp.c" address: 0x80490cf
   1  18397  Stopped    SIGTRAP     main line: 31 in "omp.c" address: 0x80490ab
   0  18395  Stopped    SIGTRAP     f line: 5 in "omp.c" address: 0x8048fa0
For example, now we switch the context to thread with ID 2. Use command thread to do so:
[name@server ~]$ pgdbg > thread 3
pgdbg > threads
0  ID PID    STATE      SIGNAL      LOCATION
=> 3  18399  Stopped    SIGTRAP     main line: 31 in "omp.c" address: 0x80490ab
   2  18398  Stopped    SIGTRAP     main line: 32 in "omp.c" address: 0x80490cf
   1  18397  Stopped    SIGTRAP     main line: 31 in "omp.c" address: 0x80490ab
   0  18395  Stopped    SIGTRAP     f line: 5 in "omp.c" address: 0x8048fa0
Graphical mode
This is the default user interface of the PGDBG debugger. If you have set the X11 forwarding then the PGDBG will start in the graphical mode in a pop-up window.
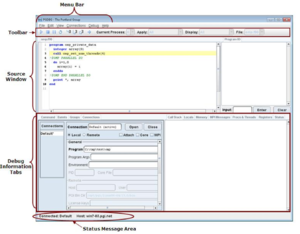
As the illustration shows, the GUI is divided into several areas:
- menu bar
- main toolbar
- source window
- program I/O window
- and debug information tabs.
Menu bar
The main menu bar contains these menus: File, Edit, View, Connections, Debug and Help. This section describes these menus and their contents. You can navigate the menus using the mouse or the system’s mouseless modifier.
Main toolbar
The debugger's main toolbar contains several buttons and four drop-down lists. The first drop-down list displays the current process or in other words, the current thread. The list’s label changes depending on whether processes or threads are described. When multiple threads are available use this drop-down list to specify which process or thread should be the current one.
The second drop-down list is labeled Apply. The selection in the Apply drop-down determines the set of processes and threads to which action commands are applied. The third drop-down list is labeled Display. The selection in the Display drop-down determines the set of processes and threads to which data display commands are applied.
The fourth drop-down list, labeled as File, displays the source file that contains the current target location.
Source window
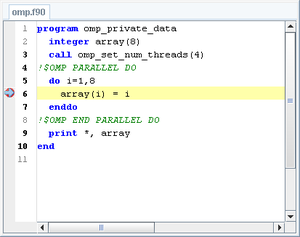
The source window (shown on the figure below) and all of the debug information tabs are dockable tabs, meaning that they can be taken apart from the main window. This can be done by double-clicking the tab. The source window shows the source code for the current session.
Program I/O Window
Program output is displayed in the Program IO tab’s central window. Program input is entered into this tab’s Input field.
Debug information tab
Debug information tabs take up the lower half of the debugger GUI. Each of these tabs provides a particular function or view of debug information. The following sections discuss the tabs as they appear from left-to-right in the GUI’s default configuration.

