Translations:PGPROF/16/en: Difference between revisions
Jump to navigation
Jump to search
(Importing a new version from external source) |
(Importing a new version from external source) |
||
| (4 intermediate revisions by the same user not shown) | |||
| Line 1: | Line 1: | ||
[[File: | [[File:pgprof-start-session.png|thumbnail|300px|Starting a new PGPROF session (click for a larger image)|left ]] | ||
In graphical mode, both data collection and analysis can be accomplished in the same session. | In graphical mode, both data collection and analysis can be accomplished in the same session most of the time. However, it is also possible to do the analysis from the pre-saved performance data file (e.g. collected in the command-line mode). | ||
There are several steps that need to be done to collect and visualize performance data in this mode.<br><br> | |||
'''Data collection''' | |||
* Launch the PGI profiler. | * Launch the PGI profiler. | ||
** Since the Pgrof's GUI is based on Java, it should be executed on the compute node in the interactive session rather than on the login node, as the latter does not have enough memory (see [[Java#Pitfalls|Java]] for more details). An interactive session can be started with <code>salloc --x11 ...</code> to enable X11 forwarding (see [[Running_jobs#Interactive_jobs|Interactive jobs]] for more details). | ** Since the Pgrof's GUI is based on Java, it should be executed on the compute node in the interactive session rather than on the login node, as the latter does not have enough memory (see [[Java#Pitfalls|Java]] for more details). An interactive session can be started with <code>salloc --x11 ...</code> to enable X11 forwarding (see [[Running_jobs#Interactive_jobs|Interactive jobs]] for more details). | ||
| Line 6: | Line 8: | ||
* Select the executable file you want to profile and then add any arguments appropriate for your profiling. | * Select the executable file you want to profile and then add any arguments appropriate for your profiling. | ||
* Click ''Next'', then ''Finish''. | * Click ''Next'', then ''Finish''. | ||
'''Analysis'''<br> | |||
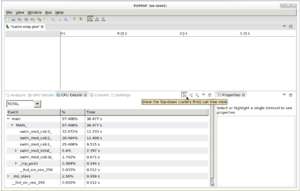
In the ''CPU Details'' tab, click on the ''Show the top-down (callers first) call tree view'' button. | |||
Latest revision as of 16:50, 15 January 2019
In graphical mode, both data collection and analysis can be accomplished in the same session most of the time. However, it is also possible to do the analysis from the pre-saved performance data file (e.g. collected in the command-line mode).
There are several steps that need to be done to collect and visualize performance data in this mode.
Data collection
- Launch the PGI profiler.
- Since the Pgrof's GUI is based on Java, it should be executed on the compute node in the interactive session rather than on the login node, as the latter does not have enough memory (see Java for more details). An interactive session can be started with
salloc --x11 ...to enable X11 forwarding (see Interactive jobs for more details).
- Since the Pgrof's GUI is based on Java, it should be executed on the compute node in the interactive session rather than on the login node, as the latter does not have enough memory (see Java for more details). An interactive session can be started with
- In order to start a new session, open the File menu and click on New Session.
- Select the executable file you want to profile and then add any arguments appropriate for your profiling.
- Click Next, then Finish.
Analysis
In the CPU Details tab, click on the Show the top-down (callers first) call tree view button.
