PGPROF/en: Difference between revisions
(Updating to match new version of source page) |
(Updating to match new version of source page) |
||
| (3 intermediate revisions by the same user not shown) | |||
| Line 1: | Line 1: | ||
<languages /> | <languages /> | ||
[[Category:Software]] | |||
PGPROF is a powerful and simple tool for analyzing the performance of parallel programs written with OpenMP, MPI, OpenACC, or CUDA. | PGPROF is a powerful and simple tool for analyzing the performance of parallel programs written with OpenMP, MPI, OpenACC, or CUDA. | ||
| Line 30: | Line 32: | ||
{{Command|pgprof -o a.prof ./a.out}} | {{Command|pgprof -o a.prof ./a.out}} | ||
The data file can be analyzed in graphical mode with the ''File | Import'' command (see | The data file can be analyzed in graphical mode with the ''File | Import'' command (see below) or in command-line mode as follows. | ||
<br><br>'''Analysis''': To visualize the performance data in command-line mode: | <br><br>'''Analysis''': To visualize the performance data in command-line mode: | ||
{{Command|pgprof -i a.prof}} | {{Command|pgprof -i a.prof}} | ||
| Line 68: | Line 70: | ||
}} | }} | ||
The output can be cropped to show one of the categories. For example, the option <code>--cpu-profiling</code> will show only the CPU results. | ===Options=== | ||
*The output can be cropped to show one of the categories. For example, the option <code>--cpu-profiling</code> will show only the CPU results. | |||
The option <code>--cpu-profiling-mode top-down</code> will make the PGPROF show the main subroutine at the top and the rest of functions it called below: | *The option <code>--cpu-profiling-mode top-down</code> will make the PGPROF show the main subroutine at the top and the rest of functions it called below: | ||
{{Command|pgprof --cpu-profiling-mode top-down -i a.prof | {{Command|pgprof --cpu-profiling-mode top-down -i a.prof | ||
| result= | | result= | ||
| Line 84: | Line 87: | ||
}} | }} | ||
To find out what part of your application takes the longest time to run you can use the option <code>--cpu-profiling-mode bottom-up</code> which orients the call tree to show each function followed by functions that called it and working backwards to the main function. | *To find out what part of your application takes the longest time to run you can use the option <code>--cpu-profiling-mode bottom-up</code> which orients the call tree to show each function followed by functions that called it and working backwards to the main function. | ||
{{Command|pgprof --cpu-profiling-mode bottom-up -i a.prof | {{Command|pgprof --cpu-profiling-mode bottom-up -i a.prof | ||
|result= | |result= | ||
| Line 112: | Line 115: | ||
* Select the executable file you want to profile and then add any arguments appropriate for your profiling. | * Select the executable file you want to profile and then add any arguments appropriate for your profiling. | ||
* Click ''Next'', then ''Finish''. | * Click ''Next'', then ''Finish''. | ||
'''Analysis''' | '''Analysis'''<br> | ||
In the ''CPU Details'' tab, click on the ''Show the top-down (callers first) call tree view'' button. | |||
[[File:pgprof2.png|thumbnail|300px|Visualizing performance data (click for a larger image)|left ]] | [[File:pgprof2.png|thumbnail|300px|Visualizing performance data (click for a larger image)|left ]] | ||
The visualization window is comprised of four panes: | The visualization window is comprised of four panes:<br> | ||
- The pane on the upper right shows the timeline with all the events ordered by the time at which they were executed.<br> | |||
- '''GPU Details''': shows performance details for the GPU kernels.<br> | |||
- '''CPU Details''': shows performance details for the CPU functions.<br> | |||
- '''Properties''': shows all the details for a selected function in the timeline window. | |||
<br clear=all> | <br clear=all> | ||
Latest revision as of 13:08, 23 September 2019
PGPROF is a powerful and simple tool for analyzing the performance of parallel programs written with OpenMP, MPI, OpenACC, or CUDA.
There are two profiling modes: Command-line mode and graphical mode.
Quickstart guide
Using PGPROF usually consists of two steps:
- Data collection: Run the application with profiling enabled.
- Analysis: Visualize the data produced in the first step.
Both steps can be accomplished in either command-line mode or graphical mode.
Environment modules
Before you start profiling with PGPROF, the appropriate module needs to be loaded.
PGPROF is part of the PGI compiler package, so run module avail pgi to see what versions are currently available with the compiler, MPI, and CUDA modules you have loaded. For a comprehensive list of PGI modules, run module -r spider '.*pgi.*'.
As of December 2018, these were:
- pgi/13.10
- pgi/17.3
Use module load pgi/version to select a version; for example, to load the PGI compiler version 17.3, use
[name@server ~]$ module load pgi/17.3
Compiling your code
To get useful information from PGPROF, you first need to compile your code with one of the PGI compilers (pgcc for C, pgc++ for C++ , pgfortran for Fortran). A source in Fortran may need to be compiled with the -g flag.
Command-line mode
Data collection: Use PGPROF to run the application and save the performance data in a file. In this example, the application
is a.out and we choose to save the data in a.prof.
[name@server ~]$ pgprof -o a.prof ./a.out
The data file can be analyzed in graphical mode with the File | Import command (see below) or in command-line mode as follows.
Analysis: To visualize the performance data in command-line mode:
[name@server ~]$ pgprof -i a.prof
The results are usually divided into several categories, for example:
- GPU kernel execution profile
- CUDA API execution profile
- OpenACC execution profile
- CPU execution profile
[name@server ~]$  ====== Profiling result:
Time(%)      Time     Calls       Avg       Min       Max  Name
 38.14%  1.41393s        20  70.696ms  70.666ms  70.731ms  calc2_198_gpu
 31.11%  1.15312s        18  64.062ms  64.039ms  64.083ms  calc3_273_gpu
 23.35%  865.68ms        20  43.284ms  43.244ms  43.325ms  calc1_142_gpu
  5.17%  191.78ms       141  1.3602ms  1.3120us  1.6409ms  [CUDA memcpy HtoD]
...
======== API calls:
Time(%)      Time     Calls       Avg       Min       Max  Name
 92.65%  3.49314s        62  56.341ms  1.8850us  70.771ms  cuStreamSynchronize
  3.78%  142.36ms         1  142.36ms  142.36ms  142.36ms  cuDevicePrimaryCtxRetain
...
======== OpenACC (excl):
Time(%)      Time     Calls       Avg       Min       Max  Name
 36.27%  1.41470s        20  70.735ms  70.704ms  70.773ms  acc_wait@swim-acc-data.f:223
 63.3%  1.15449s        18  64.138ms  64.114ms  64.159ms  acc_wait@swim-acc-data.f:302

======== CPU profiling result (bottom up):
Time(%)      Time  Name
 59.09%  8.55785s  cudbgGetAPIVersion
 59.09%  8.55785s   start_thread
 59.09%  8.55785s     clone
 25.75%  3.73007s  cuStreamSynchronize
 25.75%  3.73007s   __pgi_uacc_cuda_wait
 25.75%  3.73007s     __pgi_uacc_computedone
 10.38%  1.50269s       swim_mod_calc2_
Options
- The output can be cropped to show one of the categories. For example, the option
--cpu-profilingwill show only the CPU results.
- The option
--cpu-profiling-mode top-downwill make the PGPROF show the main subroutine at the top and the rest of functions it called below:
[name@server ~]$ pgprof --cpu-profiling-mode top-down -i a.prof
======== CPU profiling result (top down):
Time(%)      Time  Name
 97.36%  35.2596s  main
 97.36%  35.2596s   MAIN_
 32.02%  11.5976s     swim_mod_calc3_
 29.98%  10.8578s     swim_mod_calc2_
 25.93%  9.38965s     swim_mod_calc1_
  6.82%  2.46976s     swim_mod_inital_
  1.76%  637.36ms   __fvd_sin_vex_256
- To find out what part of your application takes the longest time to run you can use the option
--cpu-profiling-mode bottom-upwhich orients the call tree to show each function followed by functions that called it and working backwards to the main function.
[name@server ~]$ pgprof --cpu-profiling-mode bottom-up -i a.prof
======== CPU profiling result (bottom up):
Time(%)      Time  Name
 32.02%  11.5976s  swim_mod_calc3_
 32.02%  11.5976s   MAIN_
 32.02%  11.5976s     main
 29.98%  10.8578s  swim_mod_calc2_
 29.98%  10.8578s   MAIN_
 29.98%  10.8578s     main
 25.93%  9.38965s  swim_mod_calc1_
 25.93%  9.38965s   MAIN_
 25.93%  9.38965s     main
  3.43%  1.24057s  swim_mod_inital_
Graphical mode
In graphical mode, both data collection and analysis can be accomplished in the same session most of the time. However, it is also possible to do the analysis from the pre-saved performance data file (e.g. collected in the command-line mode).
There are several steps that need to be done to collect and visualize performance data in this mode.
Data collection
- Launch the PGI profiler.
- Since the Pgrof's GUI is based on Java, it should be executed on the compute node in the interactive session rather than on the login node, as the latter does not have enough memory (see Java for more details). An interactive session can be started with
salloc --x11 ...to enable X11 forwarding (see Interactive jobs for more details).
- Since the Pgrof's GUI is based on Java, it should be executed on the compute node in the interactive session rather than on the login node, as the latter does not have enough memory (see Java for more details). An interactive session can be started with
- In order to start a new session, open the File menu and click on New Session.
- Select the executable file you want to profile and then add any arguments appropriate for your profiling.
- Click Next, then Finish.
Analysis
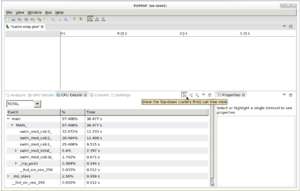
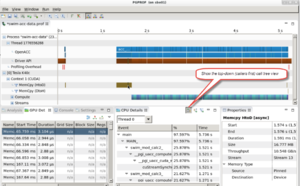
In the CPU Details tab, click on the Show the top-down (callers first) call tree view button.
The visualization window is comprised of four panes:
- The pane on the upper right shows the timeline with all the events ordered by the time at which they were executed.
- GPU Details: shows performance details for the GPU kernels.
- CPU Details: shows performance details for the CPU functions.
- Properties: shows all the details for a selected function in the timeline window.
References
PGPROF is a product of PGI, which is a subsidiary of NVIDIA Corporation.

