ARM software: Difference between revisions
(Morning after minor grammar fixups... :)) |
No edit summary |
||
| Line 160: | Line 160: | ||
= See also = <!--T:37--> | = See also = <!--T:37--> | ||
* [https://www.youtube.com/watch?v=YsF5KMr9uEQ "Code profiling on Graham"], video, 54 minutes. | * [https://www.youtube.com/watch?v=YsF5KMr9uEQ "Code profiling on Graham"], video, 54 minutes. | ||
* [ | * [[Parallel Debugging with DDT|A short DDT tutorial.]] | ||
</translate> | </translate> | ||
Revision as of 14:42, 14 April 2021
Introduction[edit]
ARM DDT (formerly know as Allinea DDT) is a powerful commercial parallel debugger with a graphical user interface. It can be used to debug serial, MPI, multi-threaded, and CUDA programs, or any combination of the above, written in C, C++, and FORTRAN. MAP—an efficient parallel profiler—is another very useful tool from ARM (formerly Allinea).
The following modules are available on Graham:
- ddt-cpu, for CPU debugging and profiling;
- ddt-gpu, for GPU or mixed CPU/GPU debugging.
The following module is available on Niagara:
- ddt
As this is a GUI application, log in using ssh -Y, and use an SSH client like MobaXTerm (Windows) or XQuartz (Mac) to ensure proper X11 tunnelling.
Both DDT and MAP are normally used interactively through their GUI, which is normally accomplished using the salloc command (see below for details). MAP can also be used non-interactively, in which case it can be submitted to the scheduler with the sbatch command.
The current license limits the use of DDT/MAP to a maximum of 512 CPU cores across all users at any given time, while DDT-GPU is limited to 8 GPUs.
Usage[edit]
CPU-only code, no GPUs[edit]
1. Allocate the node or nodes on which to do the debugging or profiling. This will open a shell session on the allocated node.
salloc --x11 --time=0-1:00 --mem-per-cpu=4G --ntasks=4
2. Load the appropriate module, for example
module load ddt-cpu
3. Run the ddt or map command.
 ddt path/to/code
 map path/to/code
- Make sure the MPI implementation is the default OpenMPI in the DDT/MAP application window, before pressing the Run button. If this is not the case, press the Change button next to the Implementation: string, and select the correct option from the drop-down menu. Also, specify the desired number of cpu cores in this window.
4. When done, exit the shell to terminate the allocation.
IMPORTANT: The current versions of DDT and OpenMPI have a compatibility issue which breaks the important feature of DDT - displaying message queues (available from the "Tools" drop down menu). There is a workaround: before running DDT, you have to execute the following command:
$ export OMPI_MCA_pml=ob1
Be aware that the above workaround can make your MPI code run slower, so only use this trick when debugging.
CUDA code[edit]
1. Allocate the node or nodes on which to do the debugging or profiling with salloc. This will open a shell session on the allocated node.
salloc --x11 --time=0-1:00 --mem-per-cpu=4G --ntasks=1 --gres=gpu:1
2. Load the appropriate module, for example
module load ddt-gpu
- This may fail with a suggestion to load an older version of OpenMPI first. In this case, reload the OpenMPI module with the suggested command, and then reload the ddt-gpu module.
 module load openmpi/2.0.2
 module load ddt-gpu
3. Ensure a cuda module is loaded.
module load cuda
4. Run the ddt command.
ddt path/to/code
If DDT complains about the mismatch between the CUDA driver and toolkit version, execute the following command and the run DDT again (use the version in this command), e.g.
export ALLINEA_FORCE_CUDA_VERSION=10.1
5. When done, exit the shell to terminate the allocation.
Using VNC to fix the lag[edit]
The instructions above use X11 forwarding. X11 is very sensitive to packet latency. As a result, unless you happen to be on the same campus as the computer cluster, the ddt interface will likely be laggy and frustrating to use. This can be fixed by running ddt under VNC.
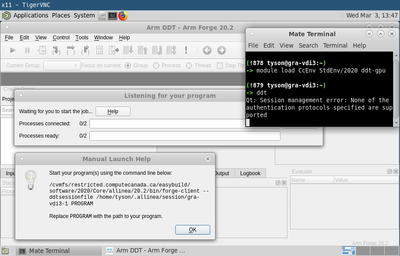
To do this, follow the directions on our VNC page to setup a VNC session. If your VNC session is on the compute node, then you can directly start your program under ddt as above. If you VNC session is on the login node or you are using the graham vdi node, then you need to manual launch the job as follows. From the ddt startup screen
- pick the manually launch backend yourself job start option,
- enter the appropriate information for your job and press the listen button, and
- press the help button to the right of waiting for you to start the job....
This will then give you the command you need to run to start your job. Allocate a job on the cluster and start your program as directed. An example of doing this would be (where $USER is your username and $PROGAM ... is the command to start your program)
[name@cluster-login:~]$ salloc ...
[name@cluster-node:~]$ /cvmfs/restricted.computecanada.ca/easybuild/software/2020/Core/allinea/20.2/bin/forge-client --ddtsessionfile /home/$USER/.allinea/session/gra-vdi3-1 $PROGRAM ...
Known issues[edit]
On graham, if you are experiencing issues with getting X11 to work, change permissions on your home directory so that only you have access.
First, check (and record if needed) current permissions with
ls -ld /home/$USER
The output should begin with:
drwx------
If some of the dashes are replaced by letters, that means your group and other users have read, write (unlikely), or execute permissions on your directory.
This command will work to remove read and execute permissions for group and other users:
chmod go-rx /home/$USER
After you are done using DDT, you can if you like restore permissions to what they were (assuming you recorded them). More information on how to do this can be found on page Sharing_data.
See also[edit]
- "Code profiling on Graham", video, 54 minutes.
- A short DDT tutorial.

