Visualization
External documentation for popular visualization packages[edit]
ParaView[edit]
ParaView is a general-purpose 3D scientific visualization tool. It is open-source and compiles on all popular platforms (Linux, Windows, Mac), understands a large number of input file formats, provides multiple rendering modes, supports Python scripting, and can scale up to tens of thousands of processors for rendering of very large datasets.
VisIt[edit]
Similar to ParaView, VisIt is an open-source, general-purpose 3D scientific data analysis and visualization tool that scales from interactive analysis on laptops to very large HPC projects on tens of thousands of processors.
VMD[edit]
VMD is an open-source molecular visualization program for displaying, animating, and analyzing large biomolecular systems in 3D. It supports scripting in Tcl and Python and runs on a variety of platforms (MacOS X, Linux, Windows). It reads many molecular data formats using an extensible plugin system and supports a number of different molecular representations.
VTK[edit]
The Visualization Toolkit (VTK) is an open-source package for 3D computer graphics, image processing, and visualization. The toolkit includes a C++ class library as well as several interfaces for interpreted languages such as Tcl/Tk, Java, and Python. VTK was the basis for many excellent visualization packages including ParaView and VisIt.
Visualization on Compute Canada systems[edit]
Start a remote desktop via VNC[edit]
Frequently, it may be useful to start up graphical user interfaces for various software packages like Matlab. Doing so over X-forwarding can result in a very slow connection to the server, one useful alternative to X-forwarding is using VNC to start and connect to a remote desktop.
For more information, please see the article on VNC.
GPU-based ParaView client-server visualization on general purpose clusters[edit]
The GPU-based Paraview has an issue on Graham, please use the CPU-based Paraview before we fix the issue.
Cedar and Graham have a number of interactive GPU nodes that can be used for remote ParaView client-server visualization.
1. First, install on your laptop the same ParaView version as the one available on the cluster you will be using; log into Cedar or Graham and start a serial GPU interactive job.
salloc --time=1:00:0 --ntasks=1 --gres=gpu:1 --account=def-someprof
- The job should automatically start on one of the GPU interactive nodes.
2. At the prompt that is now running inside your job, load the ParaView GPU+EGL module, change your display variable so that ParaView does not attempt to use the X11 rendering context, and start the ParaView server.
 module load paraview-offscreen-gpu/5.4.0
 unset DISPLAY
 pvserver
- Wait for the server to be ready to accept client connection.
 Waiting for client...
 Connection URL: cs://cdr347.int.cedar.computecanada.ca:11111
 Accepting connection(s): cdr347.int.cedar.computecanada.ca:11111
3. Make a note of the node (in this case cdr347) and the port (usually 11111) and in another terminal on your laptop (on Mac/Linux; in Windows use a terminal emulator), link the port 11111 on your laptop and the same port on the compute node (make sure to use the correct compute node).
ssh <username>@cedar.computecanada.ca -L 11111:cdr347:11111
4. Start ParaView on your laptop, go to File -> Connect (or click on the green Connect button on the toolbar) and click Add Server. You will need to point ParaView to your local port 11111, so you can do something like name = cedar, server type = Client/Server, host = localhost, port = 11111, then click Configure, select Manual and click Save.
- Once the remote is added to the configuration, simply select the server from the list and click Connect. The first terminal window that read Accepting connection ... will now read Client connected.
5. Open a file in ParaView (it will point you to the remote filesystem) and visualize it as usual.
NOTE: An important setting in ParaView's preferences is Render View -> Remote/Parallel Rendering Options -> Remote Render Threshold. If you set it to default (20MB) or similar, small rendering will be done on your laptop's GPU, the rotation with a mouse will be fast, but anything modestly intensive (under 20MB) will be shipped to your laptop and—depending on your connection—visualization might be slow. If you set it to 0MB, all rendering will be remote including rotation, so you will be really using the cluster's GPU for everything, which is good for large data processing but not so good for interactivity. Experiment with the threshold to find a suitable value.
CPU-based ParaView client-server visualization on general purpose clusters[edit]
You can also do interactive client-server ParaView rendering on cluster CPUs. For some types of rendering, modern CPU-based libraries such as OSPRay and OpenSWR offer performance quite similar to GPU-based rendering. Also, since the ParaView server uses MPI for distributed-memory processing, for very large datasets one can do parallel rendering on a large number of CPU cores, either on a single node, or scattered across multiple nodes.
1. First, install on your laptop the same ParaView version as the one available on the cluster you will be using; log into Cedar or Graham and start a serial CPU interactive job.
salloc --time=1:00:0 --ntasks=1 --account=def-someprof
- The job should automatically start on one of the CPU interactive nodes.
2. At the prompt that is now running inside your job, load the offscreen ParaView module and start the server.
 module load paraview-offscreen/5.5.2
 pvserver --mesa-swr-avx2 --force-offscreen-rendering
- The --mesa-swr-avx2 flag is important for much faster software rendering with the OpenSWR library.
- Wait for the server to be ready to accept client connection.
 Waiting for client...
 Connection URL: cs://cdr774.int.cedar.computecanada.ca:11111
 Accepting connection(s): cdr774.int.cedar.computecanada.ca:11111
3. Make a note of the node (in this case cdr774) and the port (usually 11111) and in another terminal on your laptop (on Mac/Linux; in Windows use a terminal emulator) link the port 11111 on your laptop and the same port on the compute node (make sure to use the correct compute node).
ssh <username>@cedar.computecanada.ca -L 11111:cdr774:11111
4. Start ParaView on your laptop, go to File -> Connect (or click on the green Connect button in the toolbar) and click Add Server. You will need to point ParaView to your local port 11111, so you can do something like name = cedar, server type = Client/Server, host = localhost, port = 11111, then click Configure, select Manual and click Save.
- Once the remote is added to the configuration, simply select the server from the list and click Connect. The first terminal window that read Accepting connection ... will now read Client connected.
5. Open a file in ParaView (it will point you to the remote filesystem) and visualize it as usual.
NOTE: An important setting in ParaView's preferences is Render View -> Remote/Parallel Rendering Options -> Remote Render Threshold. If you set it to default (20MB) or similar, small rendering will be done on your laptop's CPU, the rotation with a mouse will be fast, but anything modestly intensive (under 20MB) will be shipped to your laptop and—depending on your connection—visualization might be slow. If you set it to 0MB, all rendering will be remote including rotation, so you will be really using the cluster's CPU for everything, which is good for large data processing but not so good for interactivity. Experiment with the threshold to find a suitable value.
If you want to do parallel rendering on multiple CPUs, start a parallel job; don't forget to specify the correct maximum walltime limit
salloc --time=0:30:0 --ntasks=8 --account=def-someprof
and then start ParaView server with "srun":
 module load paraview-offscreen/5.5.2
 srun pvserver --mesa --force-offscreen-rendering
The flag "--mesa-swr-avx2" does not seem to have any effect when in parallel so we replaced it with the more generic "--mesa" to (hopefully) enable automatic detection of the best software rendering option.
To check that you are doing parallel rendering, you can pass your visualization through the Process Id Scalars filter and then colour it by "process id".
CPU-based VisIt client-server visualization on general purpose clusters[edit]
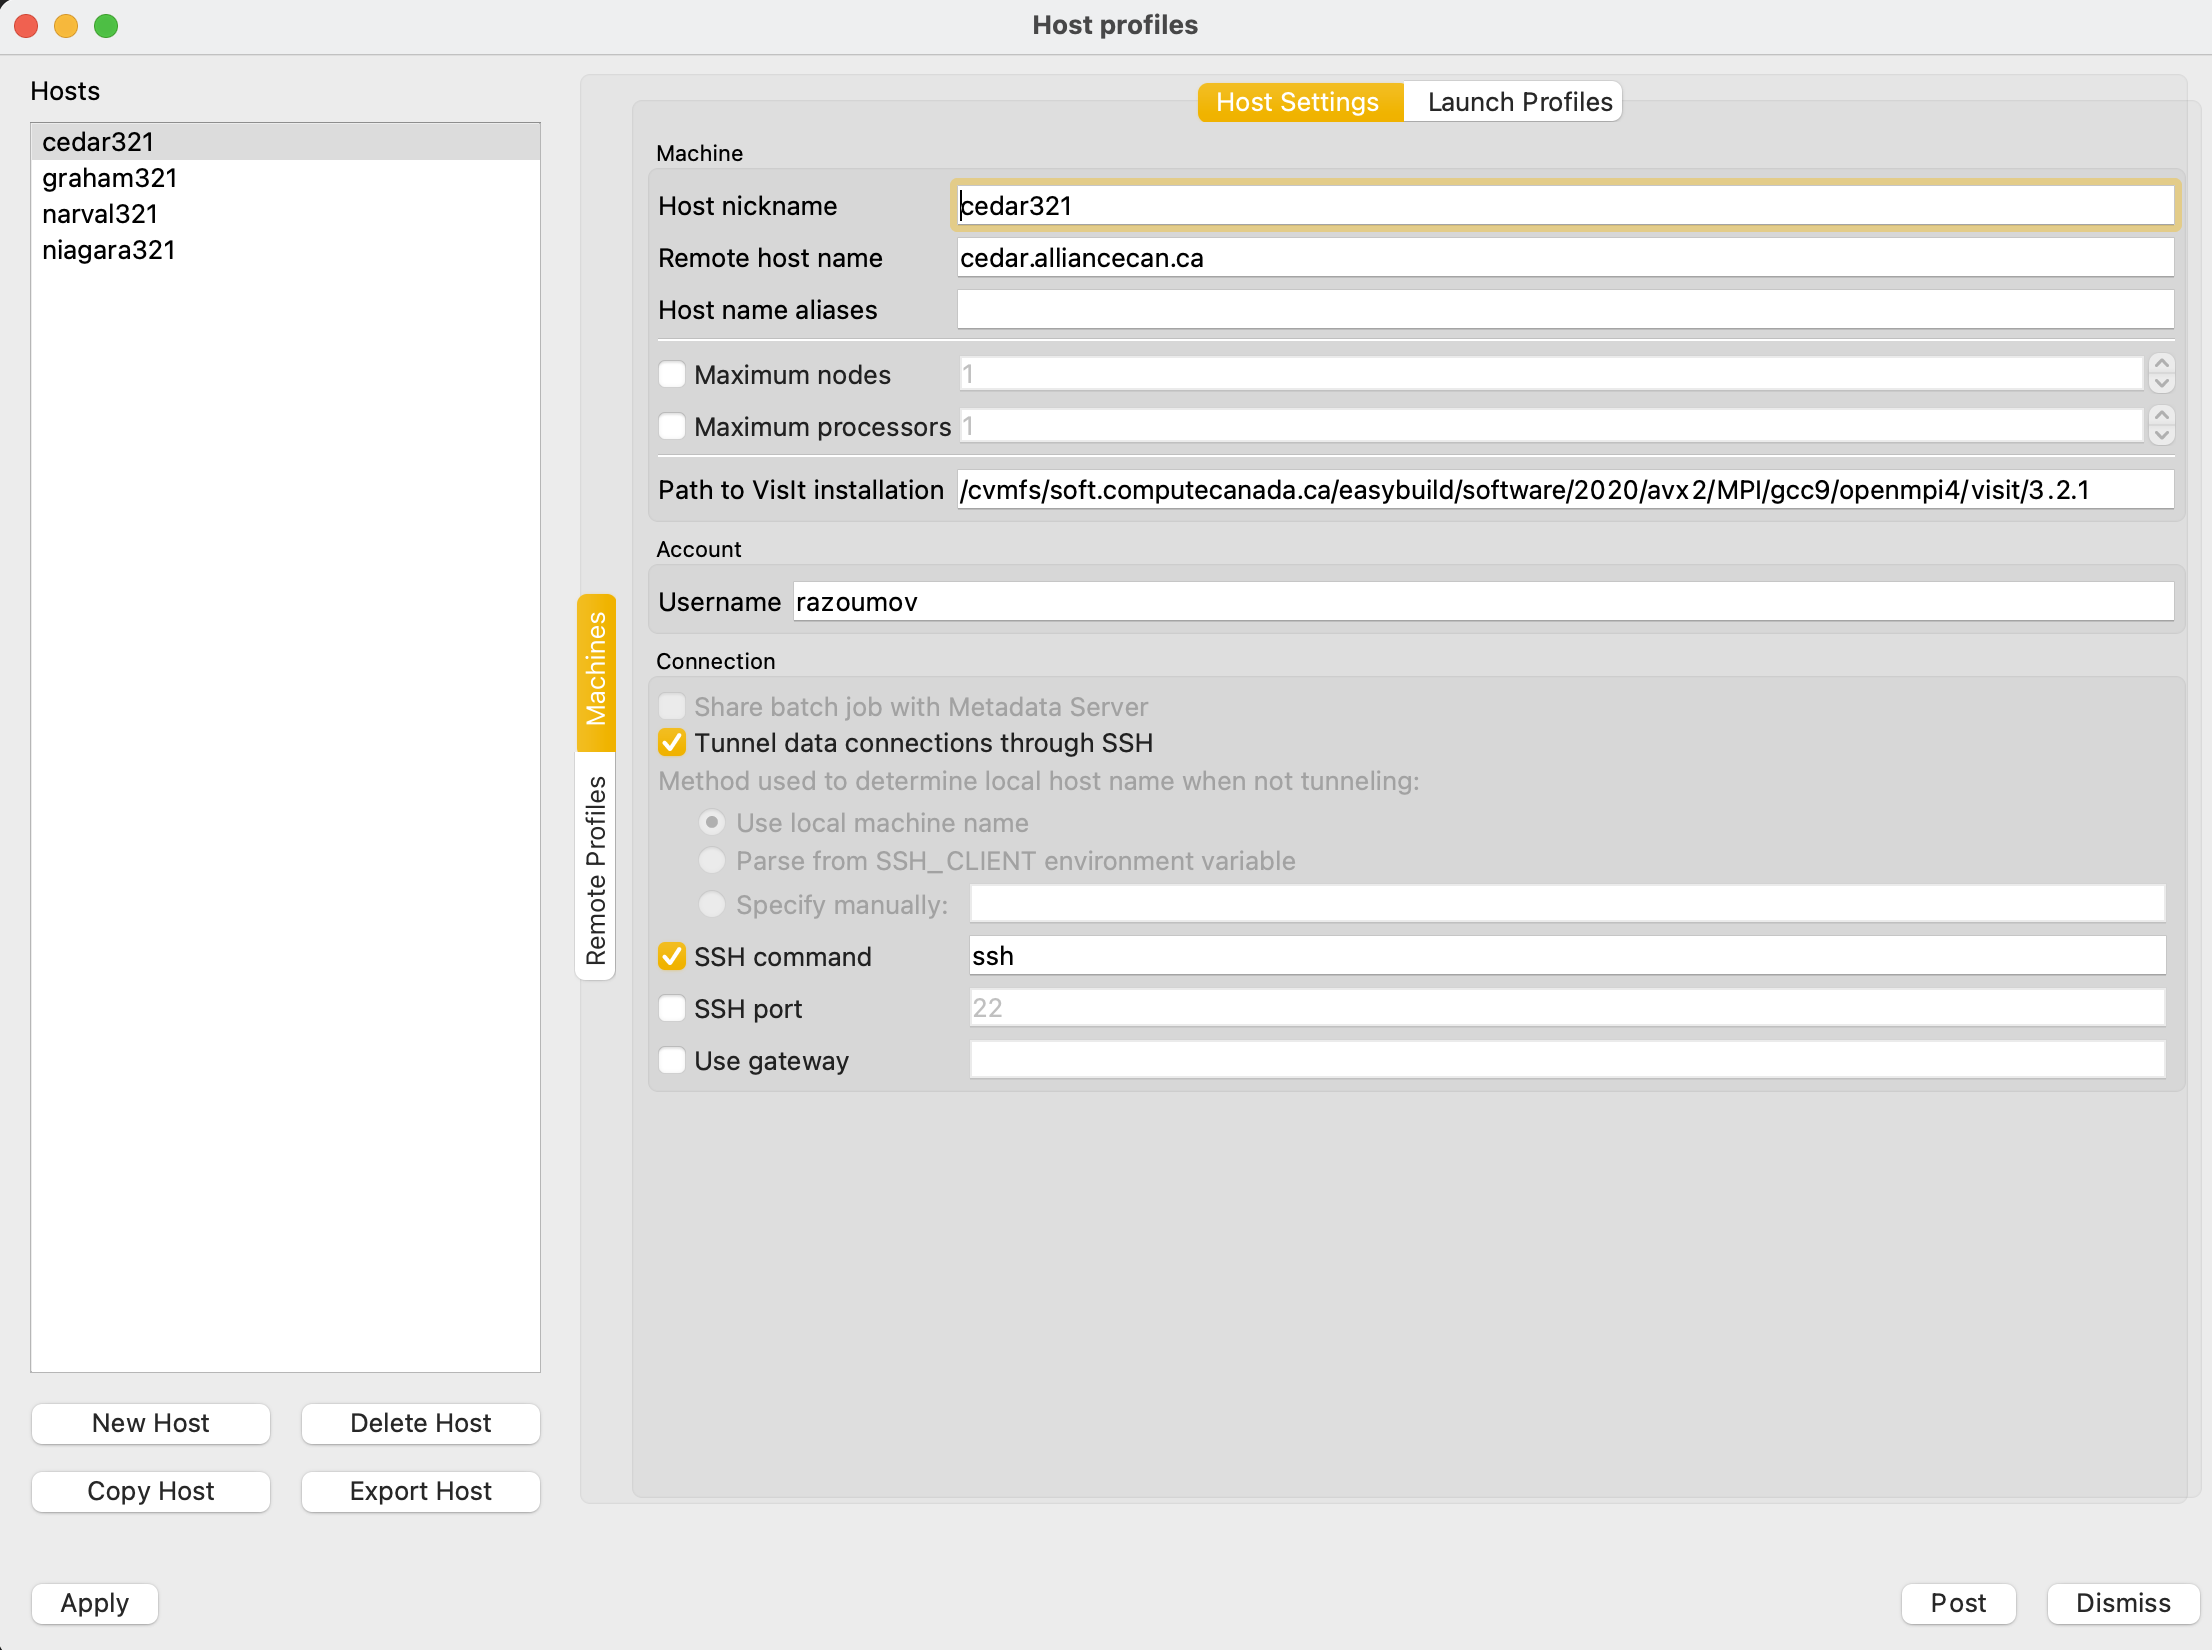
On Cedar and Graham we have two versions of VisIt installed: visit/2.12.3 and visit/2.13.0. To use remote VisIt in client-server mode, on your laptop you need the matching major version, either 2.12.x or 2.13.x, respectively. Before starting VisIt, download the Host Profile XML file host_cedar.xml. On Linux/Mac copy it to ~/.visit/hosts/, and on Windows to "My Documents\VisIt 2.13.0\hosts\". Start VisIt on your laptop, and in its main menu in Options - Host Profiles you should see a host profile called cedar. If you want to do remote rendering on Graham instead of Cedar, set
Host nickname = graham
Remote host name = graham.computecanada.ca
For both Cedar and Graham, set your CCDB username
Username = yourOwwUserName
With the exception of your username, your settings should be similar to the ones shown below:
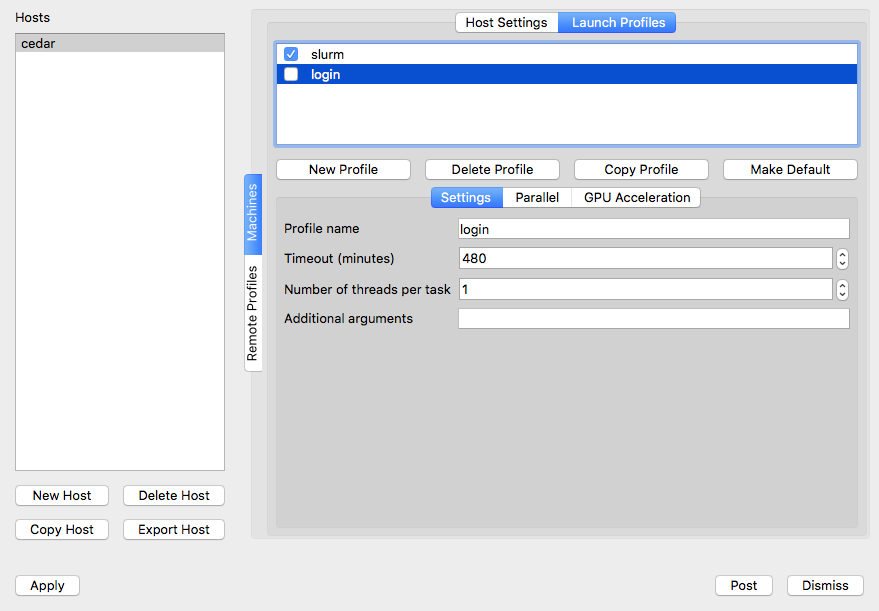
In the same setup window select the Launch Profiles tab. You should see two profiles (login and slurm):
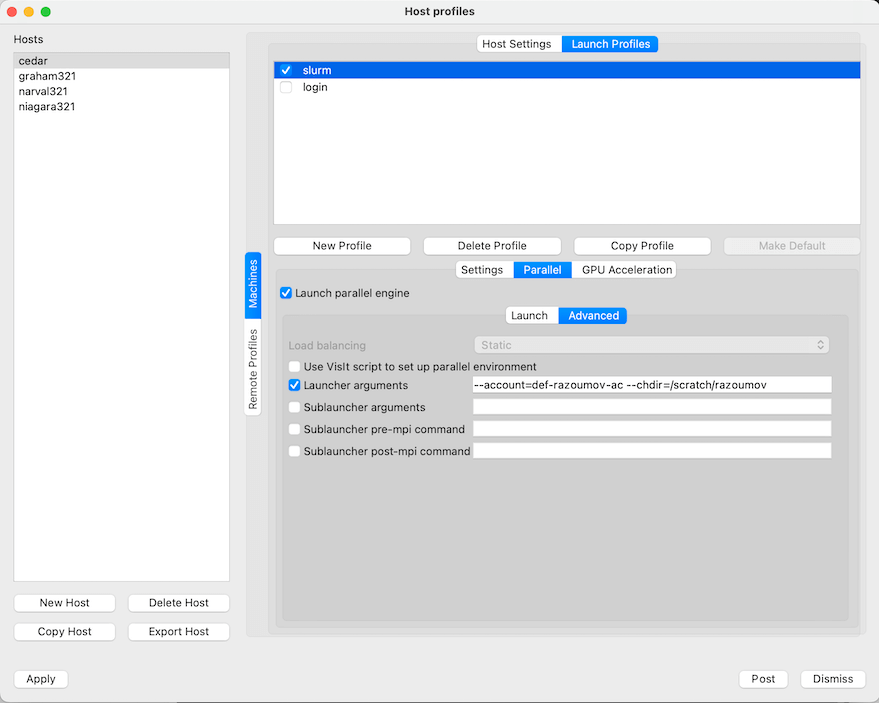
Login profile is for running VisIt's engine on a cluster's login node, which we do not recommend for heavy visualizations. Slurm profile is for running VisIt's engine inside an interactive job on a compute node. If you are planning to do the latter, select the slurm profile and then click on Parallel tab and below it on the Advanced tab and change Launcher arguments from --account=def-someuser to your default allocation, as shown below:
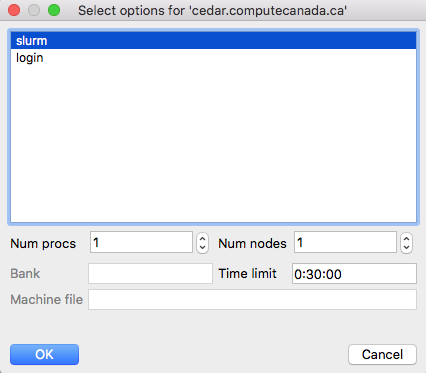
Save settings with Options - Save Settings and then restart VisIt on your laptop for settings to take effect. Start the file-open dialogue and switch the Host from localhost to cedar (or graham). Hopefully, the connection is established, the remote VisIt Component Launcher gets started on the cluster's login node, and you should be able to see the cluster's filesystem, navigate to your file and select it. You will be prompted to select between login (rendering on the login node) and slurm (rendering inside an interactive Slurm job on a compute node) profiles, and additionally for slurm profile you will need to specify the number of nodes and processors and the maximum time limit:
Click Ok and wait for VisIt's engine to start. If you selected rendering on a compute node, it may take some time for your job to get started. Once your dataset appears in the Active source in the main VisIt window, the VisIt's engine is running, and you can proceed with creating and drawing your plot.
Visualization on Niagara[edit]
Software Available[edit]
We have installed the latest versions of the open source visualization suites: VMD, VisIt and ParaView.
Notice that for using ParaView you need to explicitly specify one of the mesa flags in order to avoid trying to use openGL, i.e., after loading the paraview module, use the following command:
paraview --mesa-swr
Notice that Niagara does not have specialized nodes nor specially designated hardware for visualization, so if you want to perform interactive visualization or exploration of your data you will need to submit an interactive job (debug job, see [[1]]). For the same reason you won't be able to request or use GPUs for rendering as there are none!
Interactive Visualization[edit]
Runtime is limited on the login nodes, so you will need to request a testing job in order to have more time for exploring and visualizing your data. Additionally by doing so, you will have access to the 40 cores of each of the nodes requested. For performing an interactive visualization session in this way please follow these steps:
- ssh into niagara.scinet.utoronto.ca with the -X/-Y flag for x-forwarding
- request an interactive job, ie. debugjob this will connect you to a node, let's say for the argument "niaXYZW"
- run your favourite visualization program, eg. VisIt/ParaView module load visit visit module load paraview paraview --mesa-swr
- exit the debug session.
Remote Visualization -- Client-Server Mode[edit]
You can use any of the remote visualization protocols supported for both VisIt and ParaView.
Both, VisIt and ParaView, support "remote visualization" protocols. This includes:
- accessing data remotely, ie. stored on the cluster
- rendering visualizations using the compute nodes as rendering engines
- or both
VisIt Client-Server Configuration[edit]
For allowing VisIt connect to the Niagara cluster you need to set up a "Host Configuration".
Choose *one* of the methods bellow:
Niagara Host Configuration File[edit]
You can just download the Niagara host file, right click on the following link host_niagara.xml and select save as... Depending on the OS you are using on your local machine:
- on a Linux/Mac OS place this file in
~/.visit/hosts/ - on a Windows machine, place the file in
My Documents\VisIt 2.13.0\hosts\
Restart VisIt and check that the niagara profile should be available in your hosts.
Manual Niagara Host Configuration[edit]
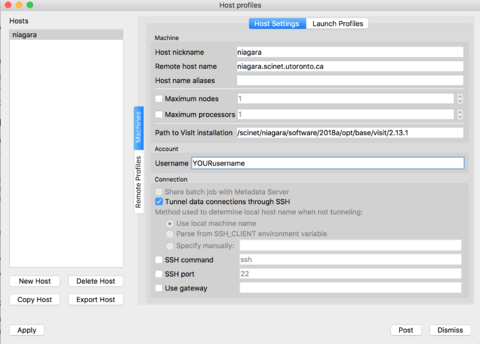
If you prefer to set up the verser yourself, instead of the configuration file from the previous section, just follow along these steps. Open VisIt in your computer, go to the 'Options' menu, and click on "Host profiles..." Then click on 'New Host' and select:
Host nickname = niagara
Remote host name = niagara.scinet.utoronto.ca
Username = Enter_Your_OWN_username_HERE
Path to VisIt installation = /scinet/niagara/software/2018a/opt/base/visit/2.13.1
Click on the "Tunnel data connections through SSH", and then hit Apply!
|
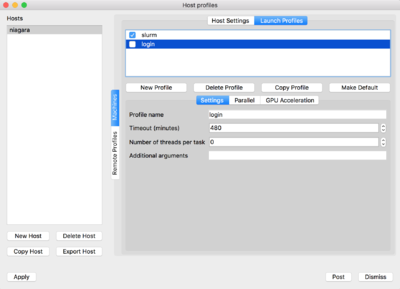
Now on the top of the window click on 'Launch Profiles' tab.
You will have to create two profiles:
-
login: for connecting through the login nodes and accessing data -
slurm: for using compute nodes as rendering engines
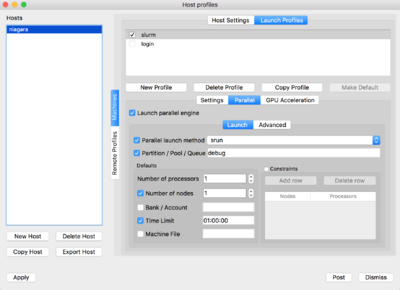
For doing so, click on 'New Profile', set the corresponding profile name, ie. login/slurm. Then click on the Parallel tab and set the "Launch parallel engine"
For the slurm profile, you will need to set the parameters as seen below:
|
|
Finally, after you are done with these changes, go to the "Options" menu and select "Save settings", so that your changes are saved and available next time you relaunch VisIt.
ParaView Client-Server Configuration[edit]
Similarly to VisIt you will need to start a debugjob in order to use a compute node to files and compute resources.
Here are the steps to follow:
- Launch an interactive job (debugjob) on Niagara, debugjob
- After getting a compute node, let's say niaXYZW, load the ParaView module and start a ParaView server, module load paraview-offscreen/5.6.0 pvserver --mesa-swr-avx2 The
- Now, you have to wait a few seconds for the server to be ready to accept client connections. Waiting for client... Connection URL: cs://niaXYZW.scinet.local:11111 Accepting connection(s): niaXYZW.scinet.local:11111
- Open a new terminal without closing your debugjob, and ssh into Niagara using the following command, ssh YOURusername@niagara.scinet.utoronto.ca -L11111:niaXYZW:11111 -N this will establish a tunnel mapping the port 11111 in your computer (
- Start ParaView (version 5.6.0) on your local computer, go to "File -> Connect" and click on 'Add Server'.
You will need to point ParaView to your local port
11111, so you can do something like
name = niagara
server type = Client/Server
host = localhost
port = 11111
then click Configure, select - Once the remote server is added to the configuration, simply select the server from the list and click Connect.
The first terminal window that read
Accepting connection...will now readClient connected. - Open a file in ParaView (it will point you to the remote filesystem) and visualize it as usual.
--mesa-swr-avx2 flag has been reported to offer faster software rendering using the OpenSWR library.
localhost) to the port 11111 on the Niagara's compute node, niaXYZW, where the ParaView server will be waiting for connections.
Manual and click Save.
Multiple CPUs[edit]
For performing parallel rendering using multiple CPUs, pvserver should be run using mpiexec, ie. either submit a job script or request a job using
salloc --ntasks=N*40 --nodes=N --time=1:00:00
 module load paraview-offset/5.6.0
 mpirun pvserver --mesa-swr-avx2
Final Considerations[edit]
Usually both VisIt and ParaView require to use the same version between the local client and the remote host, please try to stick to that to avoid having incompatibility issues, which might result in potential problems during the connections.
Other Versions[edit]
Alternatively you can try to use the visualization modules available on the CCEnv stack, for doing so just load the CCEnv module and select your favourite visualization module.
Client-server visualization in a cloud VM[edit]
Prerequisites[edit]
You can launch a new cloud virtual machine (VM) as described in the Cloud Quick Start Guide. Once you log into the VM, you will need to install some additional packages to be able to compile ParaView or VisIt. For example, on a CentOS VM you can type:
 sudo yum install xauth wget gcc gcc-c++ ncurses-devel python-devel libxcb-devel
 sudo yum install patch imake libxml2-python mesa-libGL mesa-libGL-devel
 sudo yum install mesa-libGLU mesa-libGLU-devel bzip2 bzip2-libs libXt-devel zlib-devel flex byacc
 sudo ln -s /usr/include/GL/glx.h /usr/local/include/GL/glx.h
If you have your own private-public SSH key pair (as opposed to the cloud key), you may want to copy the public key to the VM to simplify logins, by issuing the following command on your laptop:
cat ~/.ssh/id_rsa.pub | ssh -i ~/.ssh/cloudwestkey.pem centos@vm.ip.address 'cat >>.ssh/authorized_keys'
ParaView client-server[edit]
Compiling ParaView with OSMesa[edit]
Since the VM does not have access to a GPU (most Cloud West VMs don't), we need to compile ParaView with OSMesa support so that it can do offscreen (software) rendering. The default configuration of OSMesa will enable OpenSWR (Intel's software rasterization library to run OpenGL). What you will end up with is a ParaView server that uses OSMesa for offscreen CPU-based rendering without X but with both llvmpipe (older and slower) and SWR (newer and faster) drivers built. We recommend using SWR.
Back on the VM, compile cmake::
wget https://cmake.org/files/v3.7/cmake-3.7.0.tar.gz
unpack and cd there
./bootstrap
make
sudo make install
Next, compile llvm:
cd
wget http://releases.llvm.org/3.9.1/llvm-3.9.1.src.tar.xz
unpack and cd there
mkdir -p build && cd build
cmake \
 -DCMAKE_BUILD_TYPE=Release \
 -DLLVM_BUILD_LLVM_DYLIB=ON \
 -DLLVM_ENABLE_RTTI=ON \
 -DLLVM_INSTALL_UTILS=ON \
 -DLLVM_TARGETS_TO_BUILD:STRING=X86 \
 ..
make
sudo make install
Next, compile Mesa with OSMesa:
cd
wget ftp://ftp.freedesktop.org/pub/mesa/mesa-17.0.0.tar.gz
unpack and cd there
./configure \
 --enable-opengl --disable-gles1 --disable-gles2 \
 --disable-va --disable-xvmc --disable-vdpau \
 --enable-shared-glapi \
 --disable-texture-float \
 --enable-gallium-llvm --enable-llvm-shared-libs \
 --with-gallium-drivers=swrast,swr \
 --disable-dri \
 --disable-egl --disable-gbm \
 --disable-glx \
 --disable-osmesa --enable-gallium-osmesa
make
sudo make install
Next, compile ParaView server:
cd
wget http://www.paraview.org/files/v5.2/ParaView-v5.2.0.tar.gz
unpack and cd there
mkdir -p build && cd build
cmake \
     -DCMAKE_BUILD_TYPE=Release \
     -DCMAKE_INSTALL_PREFIX=/home/centos/paraview \
     -DPARAVIEW_USE_MPI=OFF \
     -DPARAVIEW_ENABLE_PYTHON=ON \
     -DPARAVIEW_BUILD_QT_GUI=OFF \
     -DVTK_OPENGL_HAS_OSMESA=ON \
     -DVTK_USE_OFFSCREEN=ON \
     -DVTK_USE_X=OFF \
     ..
make
make install
Running ParaView in client-server mode[edit]
Now you are ready to start ParaView server on the VM with SWR rendering:
./paraview/bin/pvserver --mesa-swr-avx2
Back on your laptop, organize an SSH tunnel from the local port 11111 to the VM's port 11111:
ssh centos@vm.ip.address -L 11111:localhost:11111
Finally, start the ParaView client on your laptop and connect to localhost:11111. If successful, you should be able to open files on the remote VM. During rendering in the console you should see the message "SWR detected AVX2".
VisIt client-server[edit]
Compiling VisIt with OSMesa[edit]
VisIt with offscreen rendering support can be built with a single script:
wget http://portal.nersc.gov/project/visit/releases/2.12.1/build_visit2_12_1
chmod u+x build_visit2_12_1
./build_visit2_12_1 --prefix /home/centos/visit --mesa --system-python \
   --hdf4 --hdf5 --netcdf --silo --szip --xdmf --zlib
This may take a couple of hours. Once finished, you can test the installation with:
~/visit/bin/visit -cli -nowin
This should start a VisIt Python shell.
Running VisIt in client-server mode[edit]
Start VisIt on your laptop and in Options -> Host profiles... edit the connection nickname (let's call it Cloud West), the VM host name, path to VisIt installation (/home/centos/visit) and your username on the VM, and enable tunneling through ssh. Don't forget to save settings with Options -> Save Settings. Then opening a file (File -> Open file... -> Host = Cloud West) you should see the VM's filesystem. Load a file and try to visualize it. Data processing and rendering should be done on the VM, while the result and the GUI controls will be displayed on your laptop.
yt rendering on clusters[edit]
To install yt for CPU rendering on a cluster in your own directory, please do
$ module load python
$ virtualenv astro    # install Python tools in your $HOME/astro
$ source ~/astro/bin/activate
$ pip install cython
$ pip install numpy
$ pip install yt
$ pip install mpi4py
Then, in normal use, simply load the environment and start python
$ source ~/astro/bin/activate   # load the environment
$ python
...
$ deactivate
We assume that you have downloaded the sample dataset Enzo_64 from http://yt-project.org/data. Start with the following script `grids.py` to render 90 frames rotating the dataset around the vertical axis
import yt
from numpy import pi
yt.enable_parallelism()   # turn on MPI parallelism via mpi4py
ds = yt.load("Enzo_64/DD0043/data0043")
sc = yt.create_scene(ds, ('gas', 'density'))
cam = sc.camera
cam.resolution = (1024, 1024)   # resolution of each frame
sc.annotate_domain(ds, color=[1, 1, 1, 0.005])   # draw the domain boundary [r,g,b,alpha]
sc.annotate_grids(ds, alpha=0.005)   # draw the grid boundaries
sc.save('frame0000.png', sigma_clip=4)
nspin = 90
for i in cam.iter_rotate(pi, nspin):   # rotate by 180 degrees over nspin frames
    sc.save('frame%04d.png' % (i+1), sigma_clip=4)
and the job submission script `yt-mpi.sh`
#!/bin/bash
#SBATCH --time=0:30:00   # walltime in d-hh:mm or hh:mm:ss format
#SBATCH --ntasks=4       # number of MPI processes
#SBATCH --mem-per-cpu=3800
#SBATCH --account=...
source $HOME/astro/bin/activate
srun python grids.py
Then submit the job with `sbatch yt-mpi.sh`, wait for it to finish, and then create a movie at 30fps
$ ffmpeg -r 30 -i frame%04d.png -c:v libx264 -pix_fmt yuv420p -vf "scale=trunc(iw/2)*2:trunc(ih/2)*2" grids.mp4
Upcoming visualization events[edit]
Please let us know if you would like to see a visualization workshop at your institution.
Compute Canada visualization presentation materials[edit]
Full- or half-day workshops[edit]
- VisIt workshop slides from HPCS'2016 in Edmonton by Marcelo Ponce and Alex Razoumov
- ParaView workshop slides from July 2017 by Alex Razoumov
- Gnuplot, xmgrace, remote visualization tools (X-forwarding and VNC), python's matplotlib slides by Marcelo Ponce (SciNet/UofT) from Ontario HPC Summer School 2016
- Brief overview of ParaView & VisIt slides by Marcelo Ponce (SciNet/UofT) from Ontario HPC Summer School 2016
Webinars and other short presentations[edit]
Wherever possible, the following webinar links provide both a video recording and slides.
- Data visualizaton on Cedar and Graham from October 2017 by Alex Razoumov - contains recipes and demos of running client-server ParaView and batch ParaView scripts on both CPU and GPU partitions of Cedar and Graham
- Visualization support in WestGrid / Compute Canada from January 2017 by Alex Razoumov - contains live demos of running ParaView and VisIt locally on a laptop (useful for someone starting to learn 3D visualization)
- Using ParaViewWeb for 3D visualization and data analysis in a browser from March 2017 by Alex Razoumov
- VisIt scripting from November 2016 by Alex Razoumov
- Batch visualization webinar slides from March 2015 by Alex Razoumov
- CPU-based rendering with OSPRay from September 2016 by Alex Razoumov
- Graph Visualization with Gephi from March 2016 by Alex Razoumov
- 3D graphs with NetworkX, VTK, and ParaView slides from May 2016 by Alex Razoumov
- Remote Graphics on SciNet's GPC system (Client-Server and VNC) slides by Ramses van Zon (SciNet/UofT) from October 2015 SciNet User Group Meeting
- VisIt Basics, slides by Marcelo Ponce (SciNet/UofT) from February 2016 SciNet User Group Meeting
- Intro to Complex Networks Visualization, with Python, slides by Marcelo Ponce (SciNet/UofT)
- Introduction to GUI Programming with Tkinter, from Sept.2014 by Erik Spence (SciNet/UofT)
Tips and tricks[edit]
This section will describe visualization workflows not included into the workshop/webinar slides above. It is meant to be user-editable, so please feel free to add your cool visualization scripts and workflows here so that everyone can benefit from them.
Regional visualization pages[edit]
WestGrid[edit]
SciNet, HPC at the University of Toronto[edit]
SHARCNET[edit]
- Overview
- Running pre-/post-processing graphical applications
- Supported software (see visualization section at bottom)
Visualization gallery[edit]
You can find a gallery of visualizations based on models run on Compute Canada systems in the visualization gallery. There you can click on individual thumbnails to get more details on each visualization.
How to get visualization help[edit]
Please contact Technical support.
