Translations:Snowflurry/5/en: Difference between revisions
Jump to navigation
Jump to search
(Created page with "The <code>readout</code> operation lets you specify which qubits will be measured. The SnowflurryPlots library and the <code>plot_histogram</code> function allow you to visualize the results. <noinclude> {{Command|julia |result=julia> using SnowflurryPlots julia> push!(circuit, readout(1,1), readout(2,2)) julia> plot_histogram(circuit,1000) }} </noinclude> thumb|alt=Résultats de 1000 simulations de l'état de Bell.") |
No edit summary |
||
| Line 1: | Line 1: | ||
The <code>readout</code> operation lets you specify which qubits will be measured. The | The <code>readout</code> operation lets you specify which qubits will be measured. The <code>plot_histogram</code> function from the SnowflurryPlots library allows you to visualize the results. | ||
<noinclude> | <noinclude> | ||
{{Command|julia | {{Command|julia | ||
Latest revision as of 16:44, 1 October 2024
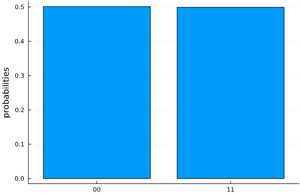
The readout operation lets you specify which qubits will be measured. The plot_histogram function from the SnowflurryPlots library allows you to visualize the results.
[name@server ~]$ julia
julia> using SnowflurryPlots
julia> push!(circuit, readout(1,1), readout(2,2))
julia> plot_histogram(circuit,1000)
