Vtune/fr: Difference between revisions
(Created page with "== Nœuds des grappes ==") |
(Created page with "== Nœuds VDI ==") |
||
| Line 57: | Line 57: | ||
# <code>amplxe-gui</code><br> | # <code>amplxe-gui</code><br> | ||
== VDI | == Nœuds VDI == | ||
# Connect to gra-vdi.computecanada.ca with [https://docs.computecanada.ca/wiki/VNC#VDI_Nodes TigerVNC] | # Connect to gra-vdi.computecanada.ca with [https://docs.computecanada.ca/wiki/VNC#VDI_Nodes TigerVNC] | ||
Revision as of 21:28, 27 July 2021
Introduction
VTune is Intel's Performance Analysis tool for applications and systems. It is capable of Analyzing both OpenMP and MPI based applications.
Module
To load the module on any Compute Canada cluster run:
[name@server ~]$ module load vtune
Tool Re-Naming
The content of this page is largely concerned with the legacy version named Intel® VTune™ Amplifier. Please note this tool has been renamed throughout Intel's documentation in latest versions (newer than the latest vtune module versions presently available on Compute Canada clusters) from Intel® VTune™ Amplifier to Intel® VTune™ Profiler. Likewise the application commands amplxe-cl and amplxe-gui have been renamed to vtune and vtune-gui for both the command line and graphical tools respectively. Once a version with the newer naming convention is available as a loadable module in the forthcoming default StdEnv/2020 environment this Wiki page will be updated accordingly. Further information can be found here.
Collect Analysis
To collect analysis information run:
[name@server ~]$ amplxe-cl -collect <analysis-type> <target_exe> <exe_arguments>
where <analysis-type> should be replaced by one of the available analysis, e.g. hotspots, and <target_exe> is the path to the executable you would like to analyze. It is recommended to compile your executable with the "-g" option and to use the same optimization level as normal so as to obtain accurate results. A listing of version specific argument options and several usage examples maybe displayed on the command line by running amplxe-cl -help, after loading the vtune module. Complete downloadable documentation for Parallel Studio XE (including VTune) for all recent versions can be found here. The latest version of the Intel VTune Profiler User Guide may be found here.
Create Report
To create a report run this command:
[name@server ~]$ amplxe-cl -report <report-type>
where <report-type> is the type of the report to generate, e.g. hotspots. See also:
Matrix Example
Analyze and generate a summary report for the Intel Matrix Sample Project run from the command line with 4 cores:
salloc --time=1:00:00 --cpus-per-task=4 --ntasks=1 --mem=16G --account=def-yours
module load StdEnv/2016.4 *OR* StdEnv/2018.3
module load intel/2019.3 (optional)
module load vtune/2019.3
cp -a $EBROOTVTUNE/vtune_amplifier/samples/en/C++/matrix .
cd matrix/linux
make icc
amplxe-cl -collect hotspots ../matrix
amplxe-cl -report summary
The latest version of matrix_multiply (uses cmake to build) can be found here.
Mode graphique
The Intel Matrix Sample Project an also be run using Vtune in GUI mode as explored here [1]. To run VTune over VNC follow the below directions depending on which system you wish to use. Running VTune graphically can be useful to generate command line configurations as discussed in [2].
Nœuds des grappes
- Connect to a cluster compute or login node with TigerVNC
module load StdEnv/2016.4 *OR* StdEnv/2018.3module load intel/2019.3(optional)module load vtune/2019.3amplxe-gui
Nœuds VDI
- Connect to gra-vdi.computecanada.ca with TigerVNC
module load CcEnv StdEnv/2016.4 *OR* StdEnv/2018.3module load intel/2019.3(optional)module load vtune/2019.3amplxe-gui
MPI example
First, load the latest VTune module.
module load StdEnv/2020
module load vtune
Then compile your MPI program as you usually would and run it inside a job or in an interactive session started by a salloc command using:
srun aps your_mpi_program.x
After the program finishes, the profiling data will be stored in a directory called aps_result_YYYYMMDD where YYYYMMDD is the current date.
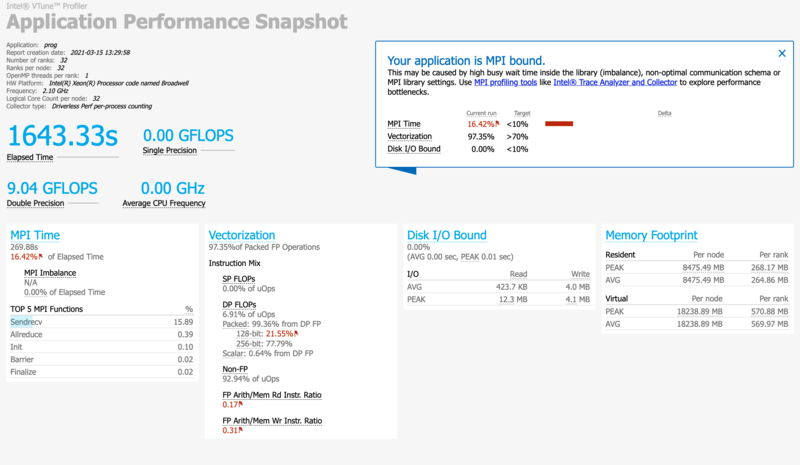
There is a lot of information you can extract from that data. To get the basic summary report of your program's performance, run:
aps-report -D aps_result_YYYYMMDD
where you would replace YYYYMMDD to match the actual directory that has been created. This command creates an HTML file, which can be copied to your own computer and viewed in a browser. The report will clearly identify performance issues that are affecting your code.
