OpenACC Tutorial - Profiling
- Understand what a profiler is
- Understand how to use PGPROF profiler
- Understand how the code is performing
- Understand where to focus your time and rewrite most time consuming routines
Code profiling
Why would one need to profile code? Because it's the only way to understand:
- Where time is being spent (Hotspots)
- How the code is performing
- Where to focus your time
What is so important about hotspots in the code ? Amdahl's law says that "Parallelizing the most time-consuming routines (i.e. the hotspots) will have the most impact".
Build the Sample Code
For this example we will use code from the repositories. Download the package and change to the cpp or f90 directory. The object of this exercise is to compile and link the code, obtain an executable, and then profile it.
As of May 2016, compiler support for OpenACC is still relatively scarce. Being pushed by NVidia, through its Portland Group division, as well as by Cray, these two lines of compilers offer the most advanced OpenACC support. GNU Compiler support for OpenACC exists, but is considered experimental in version 5. It is expected to be officially supported in version 6 of the compiler.
For the purpose of this tutorial, we use version 16.3 of the Portland Group compilers. We note that Portland Group compilers are free for academic usage.
[name@server ~]$ make
pgc++ -fast   -c -o main.o main.cpp
"vector.h", line 30: warning: variable "vcoefs" was declared but never
       referenced
       double *vcoefs=v.coefs;
                    ^

pgc++ main.o -o cg.x -fast
After the executable is created, we are going to profile that code.
For the purpose of this tutorial, we use several profilers as described below:
- PGPROF - a powerful and simple analyzer for parallel programs written with OpenMP or OpenACC directives, or with CUDA.
We note that Portland Group Profiler is free for academic usage.
- NVIDIA Visual Profiler NVVP - a cross-platform analyzing tool for the codes written with OpenACC and CUDA C/C++ instructions.
- NVPROF - a command line text-based version of the NVIDIA Visual Profiler.
PGPROF Profiler
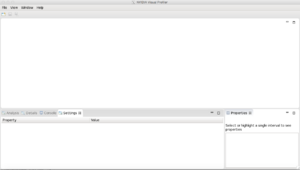
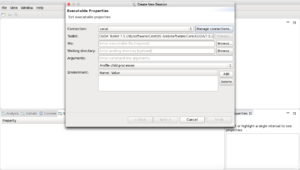
These next pictures demonstrate how to start with the PGPROF profiler. The first step is to initiate a new session. Then, browse for an executable file of the code you want to profile. Finally, specify the profiling options; for example, if you need to profile CPU activity then click the "Profile execution of the CPU" box.
NVIDIA Visual Profiler
Another profiler available for OpenACC applications is the NVIDIA Visual Profiler. It's a crossplatform analyzing tool for code written with OpenACC and CUDA C/C++ instructions.
NVIDIA NVPROF Command Line Profiler
NVIDIA also provides a command line version called NVPROF, similar to GPU prof
[name@server ~]$ nvprof --cpu-profiling on ./cgi.x
<Program output >
======== CPU profiling result (bottom up):
84.25% matvec(matrix const &, vector const &, vector const &)
84.25% main
9.50% waxpby(double, vector const &, double, vector const &, vector const &)
3.37% dot(vector const &, vector const &)
2.76% allocate_3d_poisson_matrix(matrix&, int)
2.76% main
0.11% __c_mset8
0.03% munmap
  0.03% free_matrix(matrix&)
    0.03% main
======== Data collected at 100Hz frequency
Compiler Feedback
Before working on the routine, we need to understand what the compiler is actually doing by asking ourselves the following questions:
- What optimizations were applied?
- What prevented further optimizations?
- Can very minor modifications of the code affect performance?
The PGI compiler offers you a -Minfo flag with the following options:
- accel – Print compiler operations related to the accelerator
- all – Print all compiler output
- intensity – Print loop intensity information
- ccff–Add information to the object files for use by tools
How to Enable Compiler Feedback
- Edit the Makefile
CXX=pgc++ CXXFLAGS=-fast -Minfo=all,intensity,ccff LDFLAGS=${CXXFLAGS}
- Rebuild
[name@server ~]$ make
pgc++ CXXFLAGS=-fast -Minfo=all,intensity,ccff LDFLAGS=-fast -fast   -c -o main.o main.cpp
"vector.h", line 30: warning: variable "vcoefs" was declared but never
          referenced
    double *vcoefs=v.coefs;
            ^

_Z17initialize_vectorR6vectord:
          37, Intensity = 0.0
              Memory set idiom, loop replaced by call to __c_mset8
_Z3dotRK6vectorS1_:
          27, Intensity = 1.00
              Generated 3 alternate versions of the loop
              Generated vector sse code for the loop
              Generated 2 prefetch instructions for the loop
_Z6waxpbydRK6vectordS1_S1_:
          39, Intensity = 1.00
              Loop not vectorized: data dependency
              Loop unrolled 4 times
_Z26allocate_3d_poisson_matrixR6matrixi:
          43, Intensity = 0.0
          44, Intensity = 0.0
              Loop not vectorized/parallelized: loop count too small
          45, Intensity = 0.0
              Loop unrolled 3 times (completely unrolled)
          57, Intensity = 0.0
          59, Intensity = 0.0
              Loop not vectorized: data dependency
_Z6matvecRK6matrixRK6vectorS4_:
          29, Intensity = (num_rows*((row_end-row_start)*         2))/(num_rows+(num_rows+(num_rows+((row_end-row_start)+(row_end-row_start)))))
          33, Intensity = 1.00
              Unrolled inner loop 4 times
              Generated 2 prefetch instructions for the loop
main:
     61, Intensity = 16.00
         Loop not vectorized/parallelized: potential early exits
pgc++ CXXFLAGS=-fast -Minfo=all,intensity,ccff LDFLAGS=-fast main.o -o cg.x -fast
Computational Intensity
Computational Intensity of a loop is a measure of how much work is being done compared to memory operations.
Computation Intensity = Compute Operations / Memory Operations
Computational Intensity of 1.0 or greater suggests that the loop might run well on a GPU.
Understanding the code
Let's look closely at the following code:
for(int i=0;i<num_rows;i++) {
  double sum=0;
  int row_start=row_offsets[i];
  int row_end=row_offsets[i+1];
  for(int j=row_start; j<row_end;j++) {
    unsigned int Acol=cols[j];
    double Acoef=Acoefs[j];
    double xcoef=xcoefs[Acol];
    sum+=Acoef*xcoef;
  }
  ycoefs[i]=sum;
}
Given the code above, we search for data dependencies:
- Does one loop iteration affect other loop iterations?
- Do loop iterations read from and write to different places in the same array?
- Is sum a data dependency? No, it’s a reduction.
Onward to the next unit: Adding directives
Back to the lesson plan


