Allocations and compute scheduling
Parent page: Job scheduling policies
Allocations for high-performance computing[edit]
An allocation is an amount of resources that a research group can target for use for a period of time, usually a year. This amount is either a maximum amount, as is the case for storage, or an average amount of usage over the period, as is the case for shared resources like computation cores.
Allocations are usually made in terms of core years, GPU years, or storage space. Storage allocations are the most straightforward to understand: research groups will get a maximum amount of storage that they can use exclusively throughout the allocation period. Core year and GPU year allocations are more difficult to understand because these allocations are meant to capture average use throughout the allocation period---typically meant to be a year---and this use will occur across a set of resources shared with other research groups.
The time period of an allocation when it is granted is a reference value, used for the calculation of the average which is applied to the actual period during which the resources are available. This means that if the allocation period was a year and the clusters were down for a week of maintenance, a research group would not be entitled to an additional week of resource usage. Equally so, if the allocation period were to be extended by a month, research groups affected by such a change would not see their resource access diminish during this month.
It should be noted that in the case of core year and GPU year allocations, both of which target resource usage averages over time on shared resources, a research group is more likely to hit (or exceed) its target(s) if the resources are used evenly over the allocation period than if the resources are used in bursts or if use is put off until later in the allocation period.
From compute allocations to job scheduling[edit]
Compute-related resources granted by core-year and GPU-year allocations require research groups to submit what are referred to as jobs to a scheduler. A job is a combination of a computer program (an application) and a list of resources that the application is expected to use. The scheduler is a program that calculates the priority of each job submitted and provides the needed resources based on the priority of each job and the available resources.
The scheduler uses prioritization algorithms to meet the allocation targets of all groups and it is based on a research group’s recent usage of the system as compared to their allocated usage on that system. The past of the allocation period is taken into account but the most weight is put on recent usage (or non-usage). The point of this is to allow a research group that matches their actual usage with their allocated amounts to operate roughly continuously at that level. This smooths resource usage over time across all groups and resources, allowing for it to be theoretically possible for all research groups to hit their allocation targets.
Consequences of overusing a CPU or GPU allocation[edit]
If you have jobs waiting to run, and competing demand is low enough, then the scheduler may allow more of your jobs to run than your target level. The only consequence of this is that succeeding jobs of yours may have lower priority for a time while the scheduler prioritizes other groups which were below their target. You are not prevented from submitting or running new jobs, and the average of your usage over time should still be close to your target, that is, your allocation.
It is even possible that you could end a month or even a year having run more work than your allocation would seem to allow, although this is unlikely given the demand on our resources.
Reference GPU Units (RGUs)[edit]
The performance of GPUs has dramatically increased in the recent years and continues to do so. Until RAC 2023 we treated all GPUs as equivalent to each other for allocation purposes. This caused problems both in the allocation process and while running jobs, so in the 2024 RAC year we introduced the reference GPU unit, or RGU, to rank all GPU models in production and alleviate these problems. In the 2025 RAC year we will also have to deal with new complexity involving multi-instance GPU technology.
Because roughly half of our users primarily use single-precision floating-point operations (FP32), the other half use half-precision floating-point operations (FP16), and a significant portion of all users are constrained by the amount of memory on the GPU, we chose the following evaluation criteria and corresponding weights to rank the different GPU models:
| Evaluation Criterion | Weight |
|---|---|
| FP32 score (with dense matrices on regular GPU cores) | 40% |
| FP16 score (with dense matrices on Tensor cores) | 40% |
| GPU memory score | 20% |
We currently use the NVidia A100-40gb GPU as the reference model and assign it an RGU value of 4.0 for historical reasons. We define its FP16 performance, FP32 performance, and memory size each as 1.0. Multiplying the percentages in the above table by 4.0 yields the following coefficients and RGU values for other models:
| FP32 score | FP16 score | Memory score | Combined score | Available | Allocatable | ||
|---|---|---|---|---|---|---|---|
| Coefficient: | 1.6 | 1.6 | 0.8 | (RGU) | Now | 2025 | RAC 2025 |
| H100-80gb | 3.44 | 3.17 | 2.0 | 12.2 | No | Yes | Yes |
| A100-80gb | 1.00 | 1.00 | 2.0 | 4.8 | No | ? | No |
| A100-40gb | 1.00 | 1.00 | 1.0 | 4.0 | Yes | Yes | Yes |
| V100-32gb | 0.81 | 0.40 | 0.8 | 2.6 | Yes | ? | No |
| V100-16gb | 0.81 | 0.40 | 0.4 | 2.2 | Yes | ? | No |
| T4-16gb | 0.42 | 0.21 | 0.4 | 1.3 | Yes | ? | No |
| P100-16gb | 0.48 | 0.03 | 0.4 | 1.1 | Yes | No | No |
| P100-12gb | 0.48 | 0.03 | 0.3 | 1.0 | Yes | No | No |
With the 2025 infrastructure renewal it will become possible to schedule a fraction of a GPU using multi-instance GPU technology. Different jobs, potentially belonging to different users, can run on the same GPU at the same time. Following NVidia's terminology, a fraction of a GPU allocated to a single job is called a "GPU instance", also sometimes called a "MIG instance".
The following table lists the GPU models and instances that can be selected in the CCDB form for RAC 2025. RGU values for GPU instances have been estimated from whole-GPU performance numbers and the fraction of the GPU which comprises the instance.
| Model or instance | Fraction of GPU | RGU |
|---|---|---|
| A100-40gb | Whole GPU ⇒ 100% | 4.0 |
| A100-3g.20gb | max(3g/7g, 20GB/40GB) ⇒ 50% | 2.0 |
| A100-4g.20gb | max(4g/7g, 20GB/40GB) ⇒ 57% | 2.3 |
| H100-80gb | Whole GPU ⇒ 100% | 12.2 |
| H100-1g.10gb | max(1g/7g, 40GB/80GB) ⇒ 14% | 1.7 |
| H100-2g.20gb | max(2g/7g, 40GB/80GB) ⇒ 28% | 3.5 |
| H100-3g.40gb | max(3g/7g, 40GB/80GB) ⇒ 50% | 6.1 |
| H100-4g.40gb | max(4g/7g, 40GB/80GB) ⇒ 57% | 7.0 |
Note: a GPU instance of profile 1g is worth 1/7 of a A100 or H100 GPU. The case of 3g takes into consideration the extra amount of memory per g.
Choosing GPU models for your project[edit]
The relative scores in the above table should give you a hint on the models to choose. Here is an example with the extremes:
- If your applications are doing primarily FP32 operations, an A100-40gb GPU is expected to be twice as fast as a P100-12gb GPU, but the recorded usage will be 4 times the resources. Consequently, for an equal amount of RGUs, P100-12gb GPUs should allow you to run double the computations.
- If your applications (typically AI-related) are doing primarily FP16 operations (including mixed precision operations or using other floating-point formats), using an A100-40gb will result in getting evaluated as using 4x the resources of a P100-12gb, but it is capable of computing ~30x the calculations for the same amount of time, which would allow you to complete ~7.5x the computations.
RAC awards hold RGU values constant[edit]
- During the Resource Allocation Competition (RAC), any proposal asking for GPUs must specify the preferred GPU model for the project. Then, in the CCDB form, the amount of reference GPU units (RGUs) will automatically be calculated from the requested amount of gpu-years per year of project.
- For example, if you select the narval-gpu resource and request 13 gpu-years of the model A100-40gb, the corresponding amount of RGUs would be 13 * 4.0 = 52. The RAC committee would then allocate up to 52 RGUs, depending on the proposal score. If your allocation must be moved to a different cluster, the committee will allocate gpu-years at that cluster so as to keep the amount of RGUs the same.
Detailed effect of resource usage on priority[edit]
The overarching principle governing the calculation of priority on our national clusters is that compute-based jobs are considered in the calculation based on the resources that others are prevented from using and not on the resources actually used.
The most common example of unused cores contributing to a priority calculation occurs when a submitted job requests multiple cores but uses fewer cores than requested when run. The usage that will affect the priority of future jobs is the number of cores requested, not the number of cores the application actually used. This is because the unused cores were unavailable to others to use during the job.
Another common case is when a job requests memory beyond what is associated with the cores requested. If a cluster that has 4GB of memory associated with each core receives a job request for only a single core but 8GB of memory, then the job will be deemed to have used two cores. This is because other researchers were effectively prevented from using the second core because there was no memory available for it.
Cores equivalent used by the scheduler[edit]
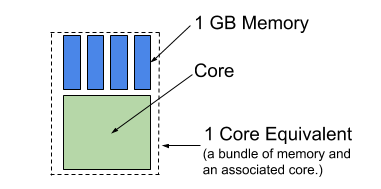
A core equivalent is a bundle made up of a single core and some amount of associated memory. In other words, a core equivalent is a core plus the amount of memory considered to be associated with each core on a given system.
Cedar and Graham are considered to provide 4GB per core, since this corresponds to the most common node type in those clusters, making a core equivalent on these systems a core-memory bundle of 4GB per core. Niagara is considered to provide 4.8GB of memory per core, making a core equivalent on it a core-memory bundle of 4.8GB per core. Jobs are charged in terms of core equivalent usage at the rate of 4 or 4.8 GB per core, as explained above. See Figure 1.
Allocation target tracking is straightforward when requests to use resources on the clusters are made entirely of core and memory amounts that can be portioned only into complete equivalent cores. Things become more complicated when jobs request portions of a core equivalent because it is possible to have many points counted against a research group’s allocation, even when they are using only portions of core equivalents. In practice, the method used by the Alliance to account for system usage solves problems about fairness and perceptions of fairness but unfortunately the method is not initially intuitive.
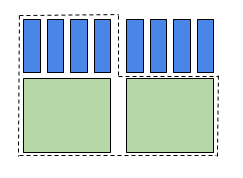
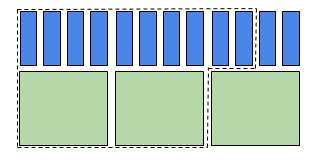
Research groups are charged for the maximum number of core equivalents they take from the resources. Assuming a core equivalent of 1 core and 4GB of memory:
- Research groups using more cores than memory (above the 1 core/4GB memory ratio), will be charged by cores. For example, a research group requesting two cores and 2GB per core for a total of 4 GB of memory. The request requires 2 core equivalents worth of cores but only one bundle for memory. This job request will be counted as 2 core equivalents when priority is calculated. See Figure 2.
- Research groups using more memory than the 1 core/4GB ratio will be charged by memory. For example, a research group requests two cores and 5GB per core for a total of 10 GB of memory. The request requires 2.5 core equivalents worth of memory, but only two bundles for cores. This job request will be counted as 2.5 core equivalents when priority is calculated. See Figure 3.
Reference GPU unit equivalent used by the scheduler[edit]
Use of GPUs and their associated resources follow the same principles as already described for core equivalents, except that a reference GPU unit (RGU) is added to the bundle alongside multiple cores and memory. This means that the accounting for GPU-based allocation targets must include the RGU. Similar to how the point system was used above when considering resource use as an expression of the concept of core equivalence, we use a similar point system here as an expression of RGU equivalence.
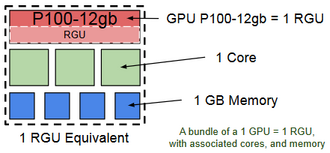
Research groups are charged for the maximum number of RGU-core-memory bundles they use. Assuming a fictive bundle of 1 RGU, 3 cores, and 4 GB of memory:
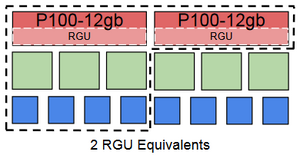
- Research groups using more RGUs than cores or memory per RGU-core-memory bundle will be charged by RGU. For example, a research group requests 2 P100-12gb GPUs (1 RGU each), 3 cores, and 4 GB of memory. The request is for 2 bundles worth of RGUs, but only one bundle for memory and cores. This job request will be counted as 2 RGU equivalents when the research group’s priority is calculated.
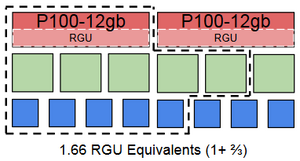
- Research groups using more cores than RGUs or memory per RGU-core-memory bundle will be charged by core. For example, a researcher requests 1 RGU, 5 cores, and 5 GB of memory. The request is for 1.66 bundles worth of cores, but only one bundle for RGUs and 1.25 bundles for memory. This job request will be counted as 1.66 RGU equivalents when the research group’s priority is calculated.
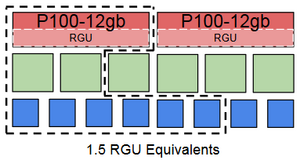
- Research groups using more memory than RGUs or cores per RGU-core-memory bundle will be charged by memory. For example, a researcher requests 1 RGU, 2 cores, and 6 GB of memory. The request is for 1.5 bundles worth of memory, but only one bundle for GPUs and 0.66 bundle for cores. This job request will be counted as 1.5 RGU equivalents when the research group’s priority is calculated.
- On the same fictive cluster, a bundle with one V100-32gb GPU, 7.8 CPU cores and 10.4 GB of memory is worth 2.6 RGU equivalents:
- On the same fictive cluster, a bundle with one A100-40gb GPU, 12 CPU cores and 16 GB of memory is worth 4.0 RGU equivalents:
Ratios in bundles[edit]
Alliance systems have the following RGU-core-memory and GPU-core-memory bundle characteristics:
| Cluster | Model or instance | RGU per GPU | Bundle per RGU | Bundle per GPU |
|---|---|---|---|---|
| Béluga* | V100-16gb | 2.2 | 4.5 cores, 21 GB | 10 cores, 46.5 GB |
| Cedar* | P100-12gb | 1.0 | 3.1 cores, 25 GB | 3.1 cores, 25 GB |
| P100-16gb | 1.1 | 3.4 cores, 27 GB | ||
| V100-32gb | 2.6 | 8.0 cores, 65 GB | ||
| Fir | H100-80gb | 12.2 | 0.98 core, 20.5 GB | 12 cores, 250 GB |
| H100-1g.10gb | 1.7 | 1.6 cores, 34.8 GB | ||
| H100-2g.20gb | 3.5 | 3.4 cores, 71.7 GB | ||
| H100-3g.40gb | 6.1 | 6 cores, 125 GB | ||
| H100-4g.40gb | 7.0 | 6.9 cores, 143 GB | ||
| Graham* | P100-12gb | 1.0 | 9.7 cores, 43 GB | 9.7 cores, 43 GB |
| T4-16gb | 1.3 | 12.6 cores, 56 GB | ||
| V100-16gb | 2.2 | 21.3 cores, 95 GB | ||
| V100-32gb | 2.6 | 25.2 cores, 112 GB | ||
| A100-80gb | 4.8 | 46.6 cores, 206 GB | ||
| Graham II | H100-80gb | 12.2 | 1.3 cores, 15.3 GB | 16 cores, 187 GB |
| H100-1g.10gb | 1.7 | 2.2 cores, 26 GB | ||
| H100-2g.20gb | 3.5 | 4.5 cores, 53.5 GB | ||
| H100-3g.40gb | 6.1 | 8 cores, 93.5 GB | ||
| H100-4g.40gb | 7.0 | 9.1 cores, 107 GB | ||
| Narval | A100-40gb | 4.0 | 3.0 cores, 31 GB | 12 cores, 124.5 GB |
| A100-3g.20gb | 2.0 | 6 cores, 62.3 GB | ||
| A100-4g.20gb | 2.3 | 6.9 cores, 71.5 GB | ||
| Rorqual | H100-80gb | 12.2 | 1.3 cores, 10.2 GB | 16 cores, 124.5 GB |
| H100-1g.10gb | 1.7 | 2.2 cores, 17.4 GB | ||
| H100-2g.20gb | 3.5 | 4.5 cores, 35.8 GB | ||
| H100-3g.40gb | 6.1 | 8 cores, 62.3 GB | ||
| H100-4g.40gb | 7.0 | 9.1 cores, 71.5 GB |
(*) All GPU resources of this cluster are not allocatable through the RAC process.
Note: While the scheduler will compute the priority based on the usage calculated with the above bundles, users requesting multiple GPUs per node also have to take into account the physical ratios.
Viewing usage of compute resources time series at portal.alliancecan.ca/slurm[edit]
The portal.alliancecan.ca/slurm site provides an intuitive interface for exploring job usage time series. The page contains a time series histogram figure window that displays usage metrics derived from job records on the Alliance national clusters. The initial metric displayed in the histogram is CPU-equivalent days for the logged-in user on the Cedar cluster. If the logged-in user does not have usage on the Cedar cluster the figure window will not have a histogram but rather contain the text “No Data or usage too small to have a meaningful plot”.The data summaries presented in the figure window can be modified by the edit and selection panels along the left margin of the page. The editing panels are "Select system and dates", "Parameters" and "SLURM account".
Displaying a specified account[edit]
The "Select user’s account" pull down menu of the "SLURM account" panel allows the user to select the specific project account to be displayed in the figure window. If the “Select user’s account” is left empty the histogram figure window will display all of the usage for the logged in user across on the specified cluster over the selected time period. The "Select user’s account" pull down menu is populated by a list of all the accounts that have job records by the logged-in user on the selected cluster over the selected time interval. Once that a single project account is selected the usage histogram figure is updated and the summary panel titled "Allocation Information" is populated with relevant details of the project account. The height of each bar in the histogram figure corresponds to the metric for that day (e.g. CPU-equivalend days) across all users in the account on the system, where the top 8 users are displayed in a unique colour stacked on top of the summed metric for all other users in gray. The figure can be navigated using native Plotly tools (e.g. zoom, pan, etc) whose icons appear at the top-right when the mouse hovers over the figure window. The figure's right side legend can also be used to manipulate the figure display such that single clicking an item will toggle the item's presence in the figure, and double clicking the item will toggle isolating the figure to the single item.
==Displaying the allocation target and queued resources
Beyond the usage values displayed in the histogram two additional values can be displayed for "Allocation target" and "Queued jobs". Once that a single account has been selected for display the "Allocation target" is enabled by default but this can be changed by setting the “Display allocation target by default” to “No” in the “Parameters” panel. The "Queued jobs" metric, which presents a sum of all resources in pending jobs at each time point, can be enabled at any time by single clicking on the item in the figure legend to the right of the usage histogram axis.
Viewing group usage summaries of compute resources at ccdb.ca[edit]
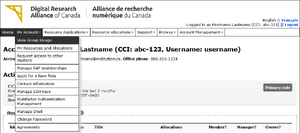
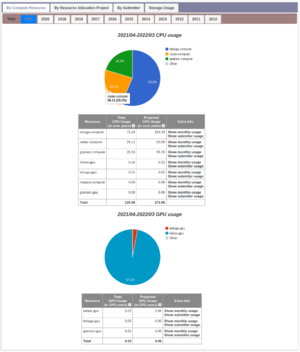
Information on the usage of compute resources by your groups can be found by logging into the CCDB and navigating to My Account > View Group Usage.
CPU and GPU core year values are calculated based on the quantity of the resources allocated to jobs on the clusters. It is important to note that the values summarized in these pages do not represent core-equivalent measures such that, in the case of large memory jobs, the usage values will not match the cluster scheduler’s representation of the account usage.
The first tab bar offers these options:
- By Compute Resource: cluster on which jobs are submitted;
- By Resource Allocation Project: projects to which jobs are submitted;
- By Submitter: user that submits the jobs;
- Storage usage is discussed in Storage and file management.
Usage by compute resource[edit]
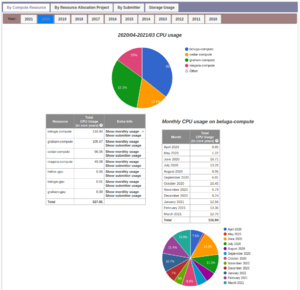
This view shows the usage of compute resources per cluster used by groups owned by you or of which you are a member for the current allocation year starting April 1st. The tables contain the total usage to date as well as the projected usage to the end of the current allocation period.
From the Extra Info column of the usage table Show monthly usage can be clicked to display a further breakdown of the usage by month for the specific cluster row in the table. By clicking Show submitter usage, a similar breakdown is displayed for the specific users submitting the jobs on the cluster.
Usage by resource allocation project[edit]
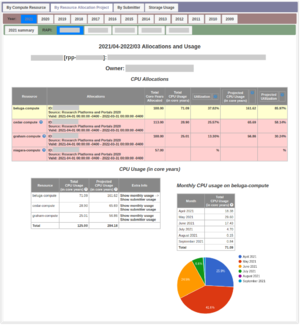
Under this tab, a third tag bar displays the RAPIs (Resource Allocation Project Identifiers) for the selected allocation year. The tables contain detailed information for each allocation project and the resources used by the projects on all of the clusters. The top of the page summarizes information such as the account name (e.g. def-, rrg- or rpp-*, etc.), the project title and ownership, as well as allocation and usage summaries.
GPU usage and Reference GPU Units (RGUs)[edit]
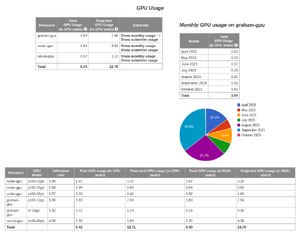
For resource allocation projects that have GPU usage the table is broken down into usage on various GPU models and measured in RGUs.
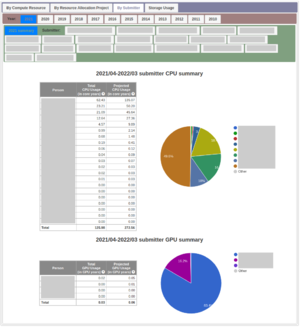
Usage by submitter[edit]
Usage can also be displayed grouped by the users that submitted jobs from within the resource allocation projects (group accounts). The view shows the usage for each user aggregated across systems.
Selecting from the list of users will display that user’s usage broken down by cluster. Like the group summaries, these user summaries can then be broken down monthly by clicking the Show monthly usage link of the Extra Info column of the CPU/GPU Usage (in core/GPU] years) table for the specific Resource row.
